Bitcoin is poised for a potential surge as technical patterns align with robust ETF inflows and growing institutional demand, signaling one of the most significant bullish phases in recent years.
October begins positively, with Bitcoin near $122,000 and strong ETF inflows from Fidelity and BlackRock. Historically called “Uptober,” this month often brings above-average gains, boosting investor optimism and signaling a potential move toward $131,000.
Bitcoin (BTC) is trading around $122,000, just below its all-time high of $124,000, reflecting modest gains as October begins, according to Brave New Coin. The Bitcoin price today is supported by strong ETF inflows and institutional demand, following a resilient September in which BTC rose over 5%, defying seasonal weakness. Traders have dubbed October “Uptober,” historically a bullish month with average gains above 20% since 2015.
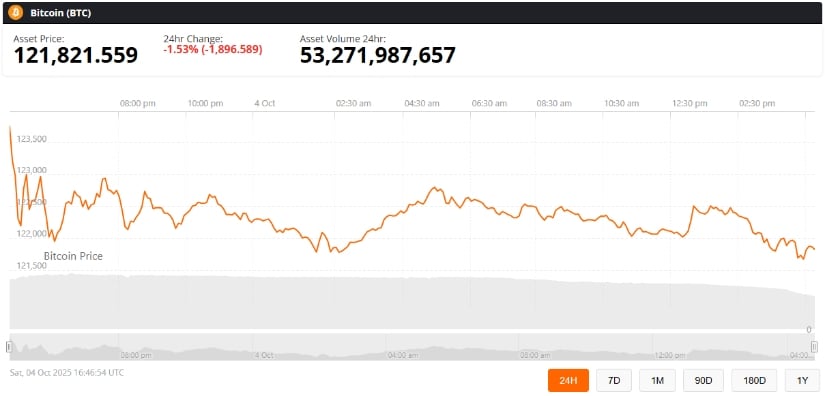
Bitcoin (BTC) was trading at around $121,821, down 1.53% in the last 24 hours at press time. Source: Bitcoin Price via Brave New Coin
Market sentiment has improved after the U.S. government’s brief shutdown, driving investors to hard assets like Bitcoin. On-chain data shows large holders accumulating, while regulated ETFs from BlackRock and Fidelity continue to support momentum. If this trend persists, analysts predict BTC could test $150,000 by year-end, signaling the next major milestone in Bitcoin’s growth.
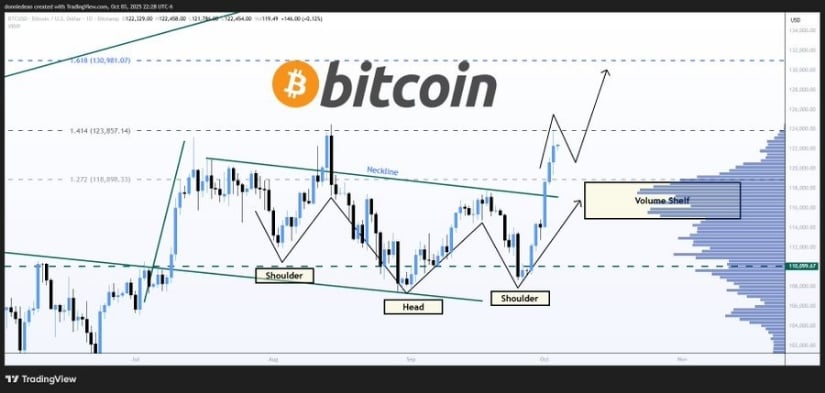
Bitcoin’s recent breakout from an inverse head-and-shoulders (IH&S) formation has sparked renewed optimism among traders. Market analyst Donald Dean noted on X, “Bitcoin is on the verge of making a new high after breaking out of an inverse head & shoulders pattern. Once $124K is exceeded, the next price target is $131K.” The pattern, often associated with the end of prolonged downtrends, suggests a strong shift from distribution to accumulation as Bitcoin regains upward momentum.
Bitcoin breaks out of an inverse head-and-shoulders pattern, pushing past $124K with a next target of $131K at the Fibonacci Golden Ratio. Source: @donaldjdean via X
The IH&S breakout has also aligned with key Fibonacci retracement levels, reinforcing the bullish case. Technical expert Rekt Capital emphasized that clearing resistance around $125,000 would “trigger extended price discovery,” potentially freeing Bitcoin from historical supply zones. With trading volume increasing across major exchanges, many view the pattern as a confirmation of trend continuation rather than a temporary rally — pointing to a sustained bullish phase for the Bitcoin BTC price in the coming months.
Institutional demand remains a key driver of Bitcoin’s current rally. According to Cointelegraph, spot Bitcoin ETF inflows exceeded $3.2 billion per week in October 2025, led by Fidelity and BlackRock. These inflows have outweighed declining retail activity, showing that long-term holders and professional investors are sustaining momentum. Citigroup projects a 12-month Bitcoin price forecast of $181,000, citing strong institutional participation and favorable macro conditions.
BTC faces a key resistance level that must be broken to enter a sustained price discovery uptrend. Source: @rektcapital via X
Historically, Bitcoin halving events have preceded major bull runs, and April 2025’s halving appears no different. Analysts compare it to 2017, when BTC surged 20× post-halving. Unlike past cycles, this rally is fueled by regulated ETF products, providing more stable liquidity. If inflows persist, Bitcoin could test the $150,000–$180,000 range by year-end.
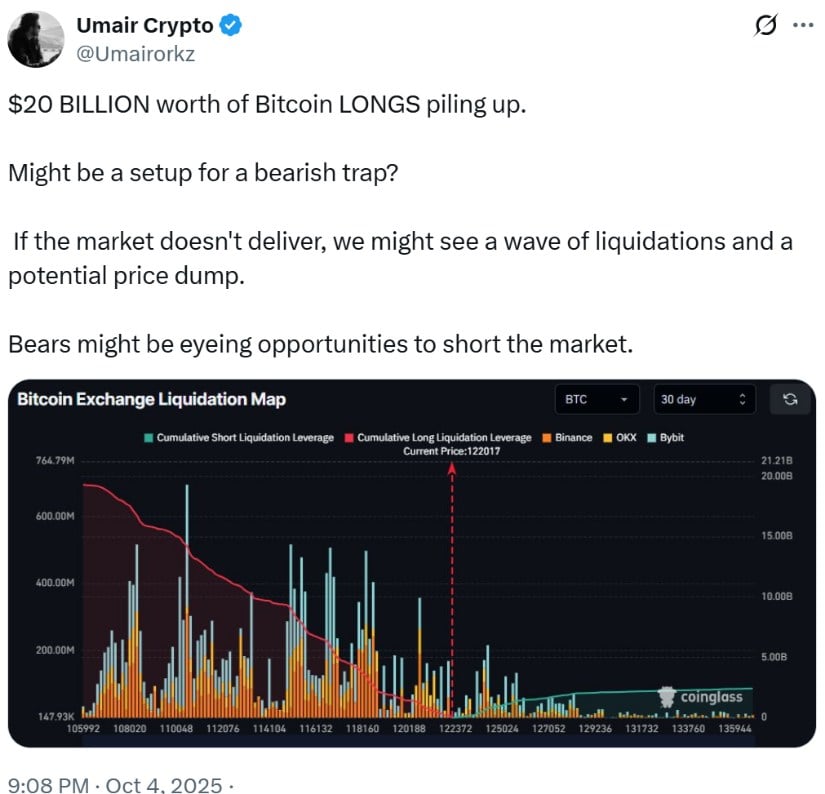
Despite Bitcoin’s bullish setup, high leverage in derivatives markets poses short-term risks. Analyst Umair Crypto warned that nearly $20 billion in Bitcoin longs could face liquidation if upward momentum falters, with open interest in perpetual futures around $40.5 billion and funding rates heavily favoring longs.
Such crowded positions can amplify volatility, as historical long-to-short ratios above 1.1:1 often precede 10–20% corrections. Traders should watch resistance near $124,000–$125,000, with a potential retracement to $117,000–$118,000 offering safer entry points before Bitcoin resumes its uptrend.
Bitcoin’s current setup reflects a strong convergence of technical, institutional, and seasonal factors. The inverse head-and-shoulders breakout, combined with robust ETF inflows and rising accumulation by large holders, points to a potential move toward $131,000 and beyond.
A buildup of $20B in Bitcoin longs could trigger a bearish trap and force liquidations if the market loses momentum. Source: @Umairorkz via X
However, the presence of $20 billion in leveraged longs introduces short-term risks, with possible retracements around $117,000–$118,000. Traders should balance optimism with caution, keeping an eye on key resistance levels, while the broader trend suggests that Bitcoin’s bullish momentum could extend into the final months of 2025.
5 Oct 2025
5 Oct 2025
5 Oct 2025
Ahmed Ishtiaque|5 Oct 2025|News|
Ahmed Ishtiaque|5 Oct 2025|News|
Usman Ali|5 Oct 2025|News|
Ahmed Ishtiaque|5 Oct 2025|News|
Ahmed Ishtiaque|5 Oct 2025|News|
Auckland / Melbourne / London / New York / Tokyo
A Techemy company
PO Box 90497, Victoria St West, Auckland Central, 1010, New Zealand.
© 2025 Brave New Coin. All Rights Reserved.
Sponsored
