Posted on — Leave a comment

Mega Millions jackpot enters longest-ever stretch without a winner – Straight Arrow News

Straight Arrow News
No one has won the Mega Millions jackpot for nearly 38 weeks, which sets the longest streak without a winner since the game began in 2002.
Mega Millions started as The Big Game in 1996 and adopted its current name in 2002 and is available in 45 states, Washington, D.C. and the Virgin Islands.
Significant changes have occurred including a cross-sell expansion in 2010 that allowed states to sell both Mega Millions and Powerball tickets.
After nearly 38 weeks and a jackpot of $843 million, no one has won the Mega Millions lottery. Friday will mark the longest losing streak since the game began in 2002.
The previous record of 37 weeks was set in January 2021 after a player in Michigan hit the lucky numbers and won the $1.05 billion jackpot. The current jackpot is the eighth largest in the history of the game.
Download the SAN app today to stay up-to-date with Unbiased. Straight Facts™.
Point phone camera here
Despite no one hitting the jackpot, lottery officials said more than a dozen people have won smaller prizes totalling more than $274 million. 
A person has a one in 290,472,336 chance to win the Mega Millions jackpot, meaning they’re 300 times more likely to be struck by lightning.
The lottery began as The Big Game in 1996, then changed its name to Mega Millions in 2002. 
Forty-five states, Washington, D.C. and the Virgin Islands participate in the game. Alabama, Alaska, Hawaii, Nevada, and Utah are the only states to not offer the game. 
The game has undergone several changes since its release. The most significant change was in 2010, after Mega Millions and Powerball, another lottery, agreed to a cross-sell expansion. This allowed states to sell both Mega Millions and Powerball tickets. In the past, states had to choose which one they could sell. 
Lottery officials said the change led to more revenue, larger jackpots and more coverage since more people from around the country could play. 
The current game format began in April, with games costing $5 each. Before April, games cost $2 each, following a format change in 2017. While many were upset with the price increase, lottery officials said the size of jackpots has increased because of the higher ticket prices.
Learn more about our emails. Unsubscribe Anytime.
Daily Newsletter
Officials draw the Mega Millions numbers every Tuesday and Friday night at 11 p.m. ET. The drawings are held in Atlanta at the studios of WSB-TV, the local ABC affiliate. The Georgia Lottery supervises the program.
The next drawing is on Friday at 11 p.m. ET.
According to media bias experts at AllSides
Awarded a perfect reliability rating from NewsGuard
The ongoing Mega Millions streak highlights the changing dynamics of national lotteries, the impact of game modifications, and the public interest generated by growing jackpots and accessibility.
The record-setting streak without a winner draws widespread public attention and influences player behavior and perceptions about odds.
Recent updates to ticket prices and cross-selling agreements have altered the game's structure, impacting jackpot sizes and revenue.
Mega Millions’ wide availability across nearly all states underscores its role as a recurring national event with broad engagement and coverage.
According to media bias experts at AllSides
Awarded a perfect reliability rating from NewsGuard
According to media bias experts at AllSides.
Perfect reliability rating, according to experts at NewsGuard
Finally, unbiased news that lets you see both sides. It’s refreshing to have facts without the spin.”
This app gives me the news without pushing a political agenda, which is rare to find.”
Unbiased news.
Directly to your inbox. Free!
Terms and Conditions
|
Privacy Policy
|
Copyright Policy
|
Cookie Settings
|
Sitemap
©️ 2025 Straight Arrow News
Daily Newsletter
Learn more about our emails. Unsubscribe anytime.
By entering your email, you agree to the Terms and Conditions and acknowledge the Privacy Policy.


source

Posted on — Leave a comment

Euromillions £25m jackpot winner announced – and they're British – Daily Express

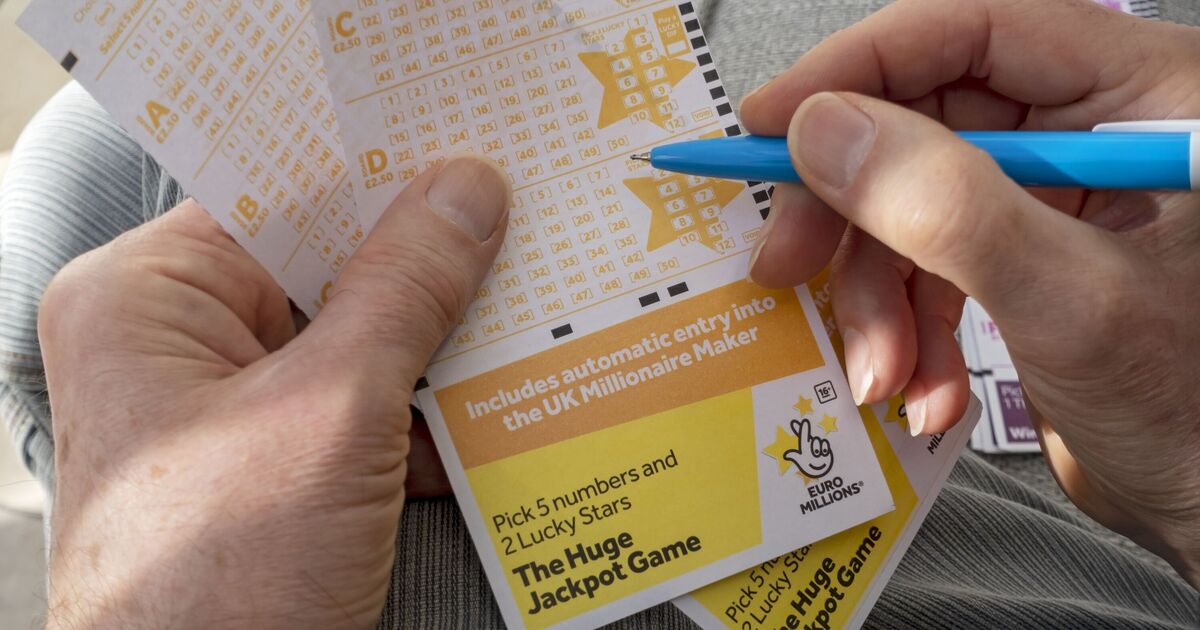
Close up of man filling in EuroMillions Lotto lottery formFor the second Friday in a row, a single UK ticket-holder has won the £25million EuroMillions jackpot, as announced by The National Lottery.
The eye-watering October 10 jackpot’s winning numbers were 06, 07, 17, 20, and 21, and the Lucky Star numbers were 01 and 10.
The winner matched all these numbers, while three individuals were able to match five numbers and one lucky star to win a whopping £40,638.50. Another five people matched just the five numbers and won £8,036.60 each.
Players of the National Lottery are being urged to check their tickets, with two millionaire jackpot prizes from last night still unclaimed.
This October 10 draw made it the second consecutive Friday night that a UK ticket-holder bagged the top prize, and the fourth time this year it went to a UK ticket-holder. Last Friday saw the £26m jackpot won by a single UK ticket-holder, while another player bagged a massive £65m on Valentine’s Day, and a third winner scooped up £83m back in January.
READ MORE: EuroMillions winning numbers and full lottery results for October 10
READ MORE: Winning EuroMillions numbers and full lottery results with Thunderball October 7
The senior winners’ adviser at Allwyn (the operator of The National Lottery), Andy Carter, said: “Wow, it’s been an exciting night for EuroMillions players, as a single UK ticket-holder has landed the amazing £25m jackpot. That’s two UK EuroMillions jackpot wins in the space of a week, after another lucky player scooped the incredible £26M jackpot in last Friday’s draw (October 3).
“Players are now urged to check their tickets and to give us a call if they think they are tonight’s lucky winner.”
Every EuroMillions ticket also bags its purchaser an automatic entry into the UK Millionaire Maker, which guarantees at least one player will pocket an incredible £1million in each and every draw. The UK Millionaire Maker Selection winner last night was TGXG94724.
These results come after the National Lottery’s live stream was interrupted last night due to technical issues. EuroMillions draws are run and held by the French operator of the National Lottery, La Française des Jeux, in Paris.
A ticket for the immensely popular EuroMillions draw which takes place every Tuesday and Friday, costs £2.50. Purchasing a EuroMillions ticket ensures automatic entry into the UK Millionaire Maker draw which creates new UK millionaires each week. The overall jackpot prize can go as high as £167million.
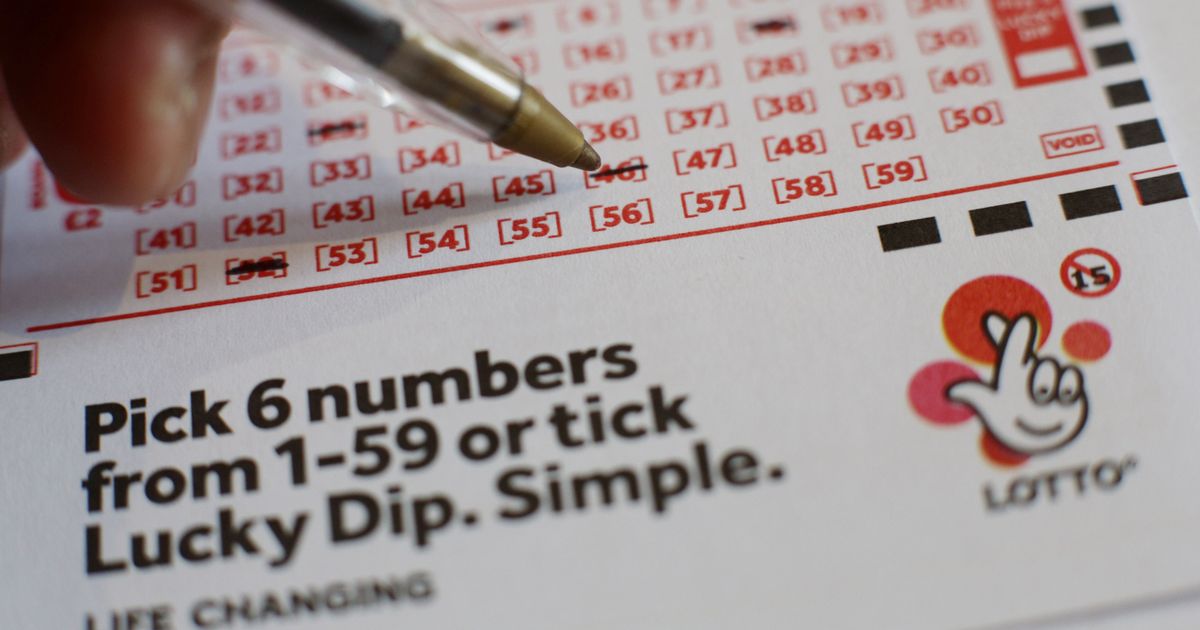
On Saturday, October 4, one ticket-holder scooped the entire £10,633,323 Lotto jackpot by matching all six main numbers: 06, 08, 12, 33, 49, and 59. Since the winning numbers were all purchased in-store, National Lottery players are being urged to carefully check their physical tickets to see if they’re the lucky winner.
The EuroMillions draw has been around for over two decades, with the first draw having taken place on February 7, 2004, by three organisations: The Camelot in the UK, France’s Française des Jeux, and Loterías y Apuestas del Estado in Spain.
In the past, one of the UK’s most massive prizes was up for grabs on December 4, 2020, with a staggering £175million EuroMillions jackpot on the line that would make its recipient even wealthier than Adele.
Some of the other winners of the massive jackpot were Chris and Colin Weir from Largs, Scotland, who bagged a monumental  £161,653,000 in the July 12, 2011, draw.
Gillian and Adrian Bayford from Suffolk’s Haverhill netted a colossal £148,656,000 after winning the August, 10, 2012, EuroMillions draw, while Jane Park went on to become Britain’s youngest lottery winner at just 17 years of age after scooping up a cool £1 million in 2013.
Yet another UK winner, who wished to remain anonymous, won the life altering jackpot of £170,221,000 in the October 8, 2019, draw.
The odds of winning any EuroMillions prize are 1 in 13 while the odds of winning the jackpot are 1 in 139 million.
We use your sign-up to provide content in ways you’ve consented to and to improve our understanding of you. This may include adverts from us and 3rd parties based on our understanding. You can unsubscribe at any time. Read our Privacy Policy
SEARCH
CONNECT WITH US
TODAY’S PAPER
See today’s front and back pages, download the newspaper, order back issues and use the historic Daily Express newspaper archive.
EXPRESS.CO.UK
Daily Express uses notifications to keep you updated

source

Posted on — Leave a comment

The symbolism behind India’s ‘Operation Sindoor’ – RNZ

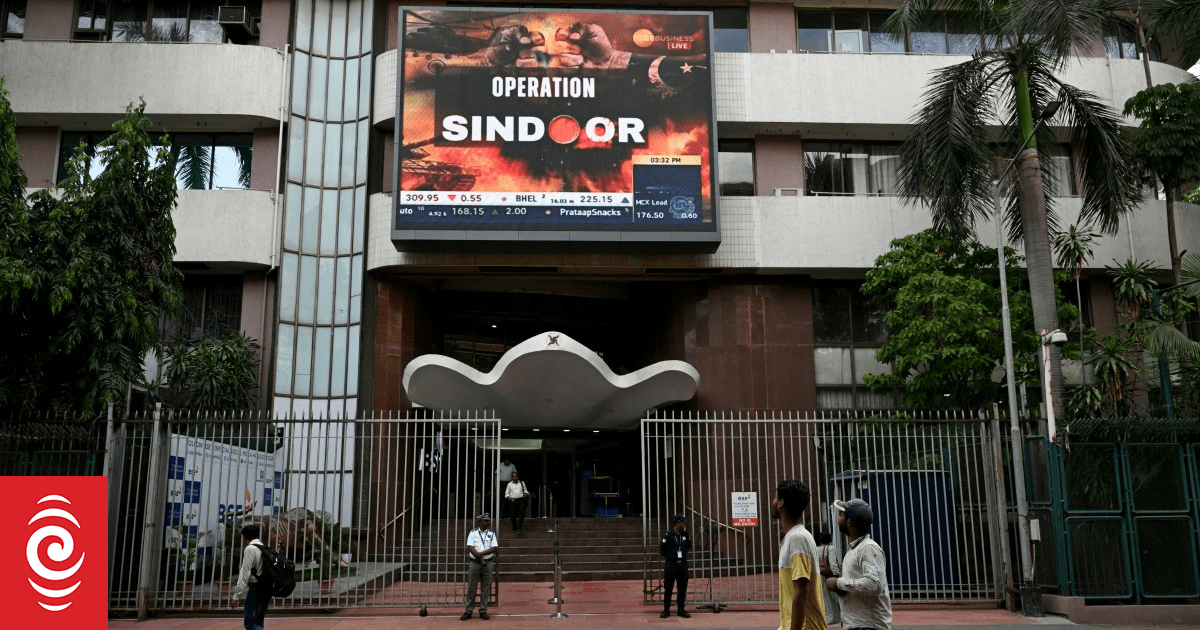
Pedestrians walk past a digital broadcast in Mumbai announcing the start of a military offensive named “Operation Sindoor” on Wednesday. Photo: INDRANIL MUKHERJEE / AFP
India launched missile strikes on nine sites in Pakistan and Pakistan-administered Kashmir early Wednesday morning in a campaign titled “Operation Sindoor”.
Two days of subsequent fighting between the nuclear-armed neighbours have killed nearly four dozen people.
India’s offensive followed a terrorist attack in Indian-administered Kashmir that killed 26 people last month.
India said Pakistan-based Islamist militants were responsible for the attack, but Pakistan has denied involvement.
But what lies behind the name given to the military operation?
Sindoor is the Hindi word for vermilion, a red powder that is a traditional marker of the marital status of Hindu women. It is usually worn in the parting of a woman’s hair.
According to custom, the powder is wiped off and never applied again if a Hindu woman is widowed.
In Hinduism, the red colour of vermilion is a symbol of fertility, love and prosperity. It’s also believed to protect the family.
According to legend, Hindu Goddess Parvati, wife of Lord Shiva, wore vermilion as a symbol of piety and affection towards her husband.
It is believed that Hindu women in the Indian subcontinent have been wearing sindoor for thousands of years, with excavated female figurines from prehistoric times depicting the ritual.
Some ancient Indian texts also reference the application of sindoor.
For a country as large and diverse as India, it is difficult to generalise anything.
The ritual remains widespread in some Hindu communities, while not so much in others.
Some women apply it every day, some only when attending family functions and religious rituals, and some never apply it.
But regardless of how often sindoor is applied, many married Hindu women hold onto an emotional attachment to the application of the powder.
Some are critical of the expectation for married Hindu women to wear Sindoor, claiming it pushes them lower in the social gender hierarchy.
They view sindoor as a symbol of patriarchal control and gender inequality.
While women are expected to wear symbols that indicate marital status, there is no such expectation of married Hindu men.
The name is an apparent reference to the widows left by the Pahalgam terrorist attacks in April that killed 26 men, most of them Hindu.
Some have interpreted the name to be vengeance for the women who were widowed because of the attack.
Taking the symbolism further, the Indian Army announced the military offensive with a grim social media image that depicts spilled vermilion resembling spattered blood.
“Justice is served,” read a message in the social media post that accompanied the image.
Copyright © 2025, Radio New Zealand
IndoNZ is a dedicated initiative producing content for and about the diverse Indian community in New Zealand.
Radio New Zealand is an independent public service multimedia organisation that provides audiences with trusted news and current affairs in accordance with the RNZ Charter. Contact the team by email at indonz@rnz.co.nz
New Zealand’s Indian and Pakistani residents call on the two neighbouring nuclear powers to halt rapidly rising hostilities.
The worst fighting in more than two decades has erupted between the two nuclear-armed enemies.
India, Pakistan and China all claim partial or complete ownership of the region, but how did that become the case?
Analysis – India and Pakistan are getting perilously close to a dangerous military confrontation.
The worst fighting in more than two decades has erupted between the two nuclear-armed enemies.

source

Posted on — Leave a comment

Bitcoin Price Forecast – BTC-USD Rebounds to $103,000 – Is the Bull Still Alive? – TradingNEWS

Bitcoin entered November under intense pressure, its price collapsing beneath the psychological $100,000 line for the first time since June before clawing back toward $103,000 by mid-week trading. The drop marked a 20 % correction from the record $126,186 high in early October, officially pushing BTC-USD into a technical bear market. Nearly $1.3 billion in leveraged long positions were liquidated within 24 hours, the heaviest wash-out since April’s post-halving volatility. On-chain metrics from CoinGlass showed open interest down 23 % week-over-week and close to 30 % of circulating supply—around 5.8 million BTC—now held at an unrealized loss, a proportion that has historically defined exhaustion phases rather than cycle tops.
Rising U.S. yields intensified the decline. The 10-year Treasury climbed to 4.15 % and the 2-year to 3.63 %, tightening global liquidity just as digital-asset inflows cooled. Data platform SoSoValue reported $1.3 billion in outflows from spot Bitcoin ETFs since October 29, led by BlackRock’s IBIT, Fidelity’s FBTC, and Grayscale’s GBTC; spot Ether ETFs lost another $500 million. With the Fed reluctant to expand liquidity operations, traders blamed the absence of the “stealth QE” that had supported prior rallies. Correlation between Bitcoin and the NASDAQ-100 surged to 0.86, proving that crypto remains tethered to risk-asset sentiment rather than trading as digital gold.
After the liquidation wave, derivatives funding flipped negative across major exchanges—−0.015 % on average—signaling that shorts now pay to hold positions. CoinGlass heat maps show liquidity bands at $102.5 K, $111.5 K, $116 K, and $117.5 K where large bids have re-appeared. Order-book depth finally turned net-positive, hinting that whales are re-accumulating into panic. Stan Low of Grvt Research called this “the fourth corrective leg of 2025’s bull structure,” projecting that drawdowns exceeding 20 % historically precede rebounds of 40 % plus within 60 days once leverage clears.
The downturn exposed how corporate treasuries handle Bitcoin exposure. Sequans Communications (SEQU.PA) liquidated 1,000 BTC for ≈ $100 million, trimming its debt from $189 million to $94 million and cutting its debt-to-NAV ratio to 39 %. The Paris-based firm still holds 2,200 BTC (≈ $240 million) but its share price has collapsed 80 % YTD, highlighting leverage risk. In contrast, MicroStrategy (NASDAQ:MSTR) added 397 BTC at $114,771 average between Oct 27 – Nov 2, while Marathon Digital Holdings (NASDAQ:MARA) posted a 92 % revenue jump YoY and its first quarterly profit, aided by diversification into AI-data-center services. Marathon’s shares rebounded 3 % after hours though still down 6.7 % intraday, demonstrating that investors reward operational pivoting more than speculative accumulation.
Glassnode data confirmed long-term holders sold ≈ $45 billion BTC since mid-October, reducing LTH supply to 14.1 million coins, the steepest fall in 17 months. Short-term holders absorbed part of that flow, suggesting redistribution rather than abandonment. The 200-week EMA around $97,400 continues to act as structural support; Bitcoin has never closed two consecutive weeks below this line during an ongoing bull phase. The RSI near 41 and the BVOL volatility index up 28 % month-to-date imply the market is oversold yet turbulent, primed for consolidation once selling fatigue completes.
Regulatory noise intensified uncertainty. New EU disclosure standards and Asian capital-flow controls weighed on sentiment, while U.S. policymakers debated fresh crypto-tax measures. The Supreme Court review of Trump-era tariffs added macro tension, feeding into broader risk aversion. Still, adoption data stayed firm: active Bitcoin addresses rose 18 % YTD, and wallet creation in South Asia and Latin America hit record highs. Capital rotation into stablecoins totaled $7.4 billion in two weeks, suggesting sidelined liquidity waiting for clarity rather than mass exit.
The Crypto Fear & Greed Index collapsed from 54 to 38 in 48 hours, marking the sharpest sentiment contraction since the FTX aftershock of 2023. Retail traders retreated: Binance and OKX stablecoin deposits reached $2.8 billion, showing defensive positioning. Former Paxful CEO Ray Youssef described the mood as “classic exhaustion—good news ignored, bad news amplified.” Such sentiment phases historically precede stabilization when liquidity pools rebuild around large-holder bids.
BTC now oscillates between $99,000 support and $106,500 resistance. A decisive close above $111,500 could expose the liquidity cluster at $117,500, while any break below $97,000 risks a slide toward $92,000, the 38.2 % Fibonacci retracement of 2024’s $64 K base. CME futures basis narrowed to +0.9 % annualized, confirming leverage compression. Options implied volatility sits near 63 %, giving long-vol traders attractive skew. Spot-volume turnover increased 41 % week-on-week, indicating capitulation energy shifting to accumulation.
The correction spilled into the entire crypto market. Ethereum (ETH-USD) plunged 13 % to $3,143, Solana (SOL-USD) lost 2.6 %, Cardano (ADA-USD) slipped 0.7 %, and XRP (XRP-USD) eased 1 % to $2.26. Aggregate digital-asset capitalization fell below $2.2 trillion, erasing $400 billion since October. Yet institutional building continued: Ripple secured a new $500 million funding round led by Fortress Investment Group and Citadel Securities, reaffirming confidence in blockchain infrastructure even amid market stress.
Bitcoin’s multi-week slide reflects the intersection of macro tightening, ETF outflows, and cyclical profit-taking rather than structural failure. With nearly one-third of supply underwater and leverage largely flushed, conditions resemble prior mid-cycle resets that paved the way for rebounds once liquidity normalized. The crucial threshold remains the 200-week EMA near $97,400; holding above it keeps the long-term bull intact. Near term, expect a volatile range between $97 K – $111 K, with upside momentum contingent on ETF inflows returning and U.S. yields easing below 4 %.
Based on current data: rating — Buy on weakness / accumulate between $97 K and $101 K; short-term bias neutral to bearish, long-term bullish.
Enter your email to receive our newsletter

source

Posted on — Leave a comment

DHS Proposes Changing H-1B Lottery to Weighted, Wage-Based System – CBIA

Track key indicators & trends
Get your questions answered
Stay informed, get engaged
Grow your business
Driving change & making a difference
Press releases and contact information
Everything you need to grow
News, resources to build your team
The following article was first posted in the Insights section of Harris Beach Murtha’s website. It is reposted here with permission.
In its ongoing efforts to revamp the H-1B visa status framework, the U.S. Department of Homeland Security issued a Notice of Proposed Rulemaking on Sept. 24, 2025, proposing a regulatory rule to change the process by which cap-subject H-1B status applicants are selected by U.S. Citizenship and Immigration Services (USCIS) for eligibility to file H-1B petitions in its annual lottery.
This substantive change proposes a weighted lottery selection system whereby H-1B beneficiaries offered the highest wages are given the highest likelihood of being chosen in the lottery and afforded the opportunity to subsequently petition for H-1B work status.
This system is a marked departure from the current system, in which there is generally no special preference given to H-1B lottery entrants.
The H-1B visa status classification is the most common visa type used for U.S. employers to hire and employ foreign nationals for temporary employment. This status is available to those hired to be employed and perform services in a “specialty occupation.”
This term is defined in the relevant immigration regulations as an occupation that:
“… requires theoretical and practical application of a body of highly specialized knowledge in fields of human endeavor including, but not limited to, architecture, engineering, mathematics, physical sciences, social sciences, medicine and health, education, business specialties, accounting, law, theology, and the arts, and which requires the attainment of a bachelor’s degree or higher in a specific specialty, or its equivalent, as a minimum for entry into the occupation in the United States.” [8 U.S.C. § 214.2(h)(4)(ii)]
To implement and set limits upon the H-1B program, Congress set an annual quota restricting its use.
The current framework caps the annual quota for new H-1B petitions for those who have not been granted H-1B status during the previous six years at 65,000.
The H-1B cap numbers have not been updated for many years and have not accounted for population growth or the current needs of the U.S. economy.
An additional 20,000 slots are also allocated for those foreign national beneficiaries who have earned the minimum of a master’s degree from a qualifying U.S. educational institution.
Due to political constraints, the H-1B cap numbers have not been updated for many years and have therefore not accounted for population growth or the current needs of the U.S. economy.
Accordingly, for many years, the annual H-1B quota has been filled nearly instantaneously upon the commencement of the filing eligibility period.
This situation has led to the creation of the H-1B cap lottery system, wherein a random lottery system is used annually at the outset/opening of each H-1B cap season to determine which applicants will fill the available cap slots and be afforded the opportunity to petition for, and gain, H-1B status each year.
Until now, no special consideration in the annual cap lottery was given regarding the compensation level for each offered H-1B position.
Indeed, the plain language of the controlling Immigration and Nationality Act statute states that the H-1B cap slots conferring H-1B eligibility should be “issued … in the order in which petitions are filed for such visas or status” (thereby permitting the cap lottery system to be used at the commencement of each year’s quota system implementation in a random nature, and not by limiting/favoring the availability of the H-1B program to those employers who pay the highest compensation).
In contrast, the proposed new DHS rule drastically changes the way in which those who registered for the H-1B cap lottery are selected to have the opportunity to petition for H-1B status.
It instead institutes a new wage-based selection process system where the selection of H-1B registrations are prioritized/weighted based upon the salary compensation level the employer plans to pay the H-1B worker.
For instance, there are four wage levels currently used by the U.S. Department of Labor to categorize H-1B specialty occupations.
The selection of H-1B registrations are prioritized/weighted based upon salary compensation level.
This new rule utilizes that mechanism to prioritize each submitted lottery registration in terms of its likelihood to be chosen as a lottery winner.
In effect, those H-1B beneficiaries to be paid at the highest Level 4 wage will possess four times the chance of being selected in the lottery than those being paid at the Level 1 “entry-level,” those with Level 3 qualifying wage compensation will have three times the chance of success as Level 1 applicants, etc.
As a result, USCIS has acknowledged the probability of Level 1 workers being selected to be eligible to file an H-1B cap-subject petition will decrease by 48%!
Immigration advocates argue this proposed rule/regulation violates Congressional intent regarding the promulgation and implementation of the H-1B program, as Congress did not intend to limit the program’s use to employers with the ability to pay the highest wages.
Indeed, it can be rationally said the U.S immigration system as a whole was not created for, nor intended to be, a plutocratic type of system favoring the wealthy.
Immigration advocates claim this change will have a substantial negative impact on a wide range of U.S. employers and industries, including the healthcare and technology fields.
Additionally, they argue the new system will limit the ability of smaller businesses and startups to use the program to foster innovation and growth, thereby unnecessarily hindering the potential success of their business efforts.
Therefore, they say this consequence could ultimately hurt, not help, the U.S. economy.
Conversely, large corporations that can afford to pay the higher wages are enthused by this change, as it will undoubtedly lead to higher percentages of their H-1B cap lottery entrants being selected as winners, affording them the opportunity to employ more of these workers each year than prior lottery results have yielded.
The new system will limit the ability of smaller businesses and startups to use the program to foster innovation and growth.
In terms of what comes next, the 30-day comment period required by the Administrative Procedure Act ended in late October.
During this period, comments were submitted by immigration advocates, including the American Immigration Lawyers Association, in opposition to the proposed rule.
AILA requested that, at a minimum, this rule be delayed in its implementation and not used for the upcoming fiscal year 2027 cap filing season (the lottery for which will be administered in March of 2026).
Judicial action is also being contemplated by an array of immigration advocacy groups, but no lawsuit contesting the measure has been filed as of this writing.
Therefore, barring these types of developments to pause or prevent its implementation, the rule is likely to complete its required regulatory process in time to be implemented for the next H-1B cap lottery process in March.
Harris Beach Murtha’s Immigration Practice Group will continue monitoring this and related H-1B issues and update the public regarding future developments.
About the author: David Jacobson is a Harris Beach Murtha member who focuses his practice on employment-based immigration matters for corporate clients in various industries, including financial services, pharmaceuticals, media, information technology, real estate, construction, chemical and environmental engineering, market research, and advertising.
Your email address will not be published. Required fields are marked


The latest news and information delivered directly to your inbox.
CBIA IS FIGHTING TO MAKE CONNECTICUT A TOP STATE FOR BUSINESS, JOBS, AND ECONOMIC GROWTH. A BETTER BUSINESS CLIMATE MEANS A BRIGHTER FUTURE FOR EVERYONE.
© 2025 CBIA
350 Church Street
Hartford, CT 06103

860.244.1900

source